The Proven Sales Growth Formula That Every Business Should Know

If you sell software to other businesses, you probably already know that growth does not come from magic. It comes from a repeatable formula you can measure, iterate on, and scale. I’ve worked with sales teams that chase shiny tactics and others that build a reliable engine. The difference is usually one thing: clarity about the sales growth formula.
In this post I'll walk through a simple, actionable sales growth framework that B2B SaaS teams can use right away. I’ll show you how to calculate sales growth, what levers to pull, common mistakes to avoid, and how better demos and sales enablement speed everything up. Think of this as a practical guide, not theory. You’ll get clear metrics, easy examples, and steps you can test next week.
Why a sales growth formula matters
Random improvements feel good. They don’t last. A formula forces you to decompose revenue into parts you can measure and improve. That’s the difference between hope and execution.
When you know how to calculate sales growth, you stop guessing which initiatives actually move the needle. You can test specific changes, measure impact, and scale what works. Plus, stakeholders like founders and VCs want repeatable results. A formula gets everyone speaking the same language.
The core revenue growth formula
The basic revenue growth formula is simple and brutally useful. It tells you whether you're actually growing and by how much.
Sales Growth Rate = (Revenue this period - Revenue last period) / Revenue last period * 100%
Example: If your ARR was $1,000,000 last year and $1,250,000 this year, your sales growth rate is 25 percent.
That’s the headline number. But the formula by itself only tells you that growth happened. It doesn’t tell you why. For operational teams, we need to break revenue into the parts that we can control.
Decomposing revenue into controllable levers
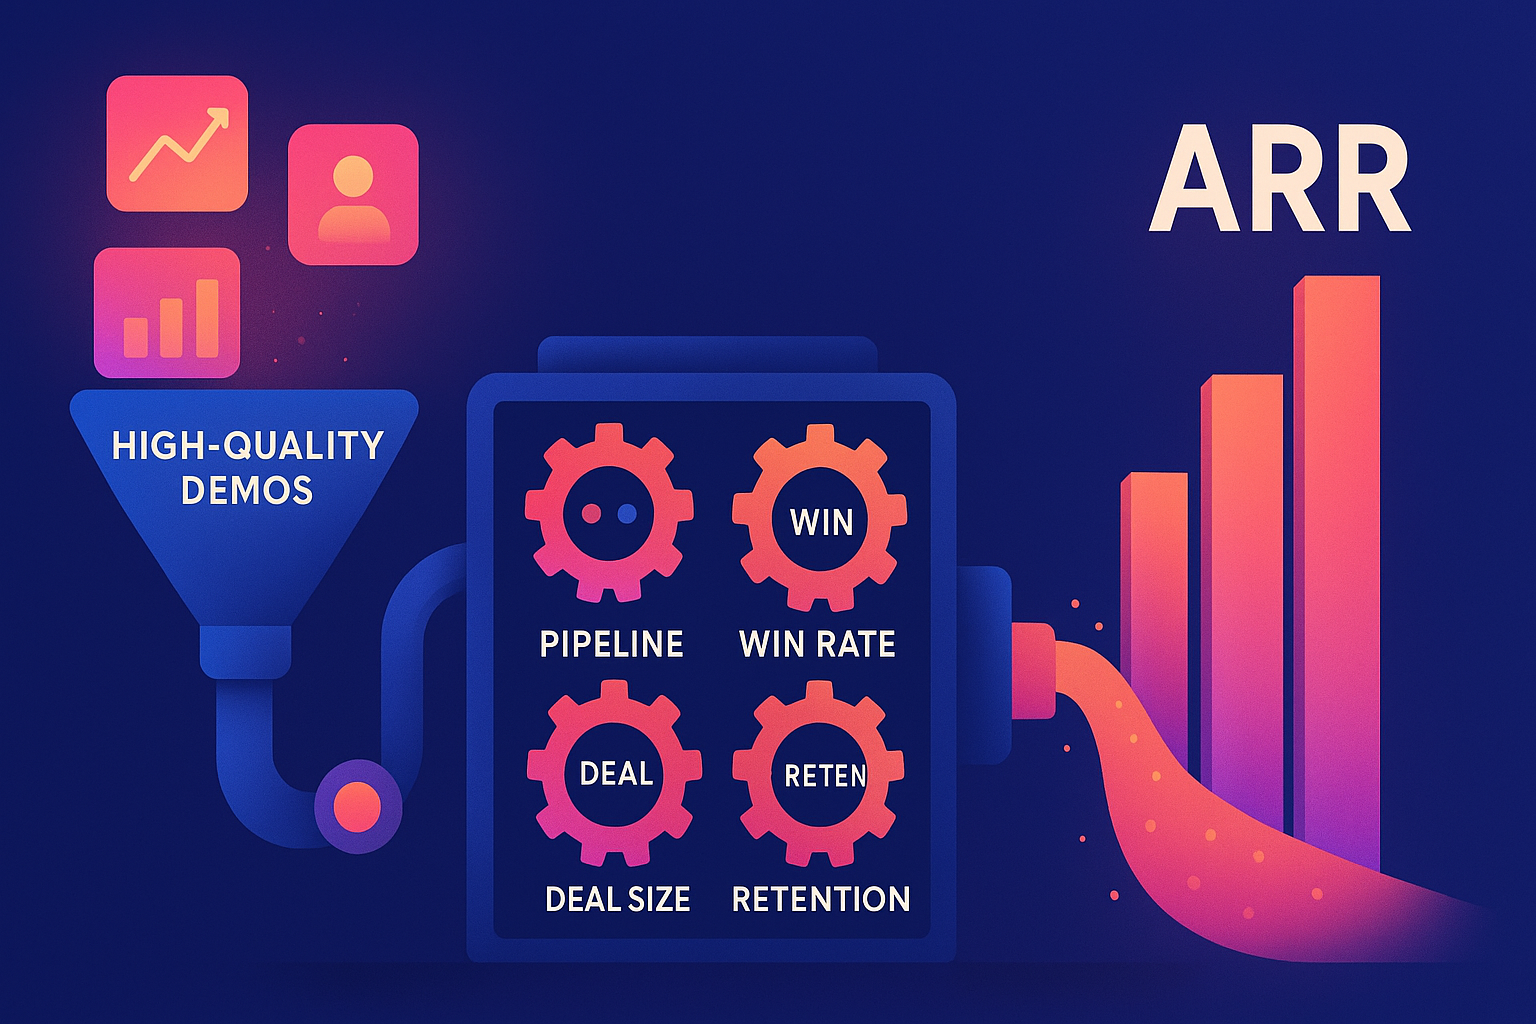
I like to describe revenue as the product of a few clear variables you can measure and influence. For subscription businesses, a practical breakdown looks like this:
- Number of Opportunities Entering Pipeline
- Conversion Rate from Opportunity to Closed Deal
- Average Deal Size (ACV or ARR per deal)
- Retention and Expansion (renewals and upsell)
Multiply those together and you get revenue. That makes it easier to test small changes and predict impact.

A clean, testable sales growth formula
Write it like this when you want to forecast or run experiments:
Revenue = Number of Qualified Opps x Win Rate x Average Deal Size
And for subscription companies that care about expansion and churn, add:
ARR Growth = New ARR + Expansion ARR - Contraction ARR - Churned ARR
These formulas let you isolate where growth is coming from: new logos, bigger deals, or expansion within existing customers. That matters a lot for sales strategy.
How to calculate sales growth in practice
Here are the practical steps I use with clients when we’re figuring out "how to calculate sales growth" for the quarter.
- Pick your baseline. Use ARR, total revenue, or MRR consistently. Don’t mix them mid-analysis.
- Choose a period. Monthly, quarterly, or annually. Monthly is good for quick experiments. Quarterly reduces noise.
- Calculate headline growth using the sales growth formula above.
- Break revenue into new vs expansion vs churn.
- Map each number back to a metric you can optimize: pipeline volume, conversion, deal size, churn rate.
Quick example. Let’s say last quarter you had $500,000 ARR. This quarter you have $600,000 ARR. Your sales growth rate is 20 percent. Now split that $100,000 growth into new ARR and expansion ARR. Maybe $70,000 is new and $30,000 is expansion. Now you know new logo motion is doing most of the heavy lifting.
Key sales performance metrics to track
You can’t improve what you don’t measure. Here are the metrics that really matter for a B2B SaaS sales team.
- ARR / MRR - headline revenue
- New ARR - incoming business from new customers
- Expansion ARR - upsell and cross-sell within existing customers
- Churn ARR - lost revenue from cancellations and downgrades
- Pipeline volume - number and value of open opportunities
- Win rate - percent of opportunities won
- Average deal size - ACV or contract value
- Sales cycle length - days from qualified lead to close
- Lead to opportunity conversion - top-of-funnel efficiency
- Customer acquisition cost (CAC) and LTV/CAC
In my experience, teams obsess over demo engagement and conversion early, then move to retention once they hit product-market fit. If you’re still small, prioritize pipeline and win rate. If you’re scaling, focus on expanding customers and keeping CAC healthy.
How each lever impacts growth - and where to start
If you want to increase revenue this quarter, which lever gives the biggest lift? The answer depends on your stage and constraints, but here’s a simple prioritization framework I use with sales leaders.
- Win rate - Low hanging fruit. Small improvements in win rate compound quickly. Better qualification and better demos usually move the needle here.
- Average deal size - A modest increase in ACV can drive big revenue gains. Try packaging, tiering, or targeted upsells.
- Pipeline volume - If there’s not enough pipeline, nothing else matters. Ramp marketing and SDR efforts to feed sales.
- Sales cycle length - Shortening cycles frees up reps to close more deals per period.
- Retention and expansion - For mature SaaS companies, reducing churn and increasing expansion ARR is the most sustainable growth.
Here’s a quick example to illustrate impact. Imagine a company with $1M ARR, 25 percent win rate, and average deal size of $10k. If they improve win rate by 20 percent (to 30 percent), keeping everything else constant, revenue rises proportionally. Small percentage changes add up.
Practical experiments you can run this week
You don’t need a six month initiative to see results. Try these small experiments that target the main levers.
- Demo script tweak - shorten the intro and surface ROI earlier. Track demo-to-trial conversion.
- Qualification checklist - add a 3-question qualification step to disqualify low-fit leads faster.
- Average deal size test - introduce a mid-tier package or add-on with clear pricing and value.
- Sales cadence change - add a one-touch video or personalized report in follow-ups.
- Renewal outreach - start outreach 90 days before renewal and include a one-click upsell.
I've seen teams lift conversion by 10 to 30 percent with simple demo and qualification changes. The trick is to run one experiment at a time and measure the effect on a single metric.
Demo quality matters more than you think
Let me be blunt. A lot of lost deals don’t happen because of price or product gaps. They happen because the demo failed to prove value quickly.
Poor demos waste time, stretch the sales cycle, and lower win rates. Fixing demos is often the fastest way to improve sales performance metrics. And yes, DemoDazzle is biased here, because we work with teams to make demos more persuasive. Still, the point stands whether you use DemoDazzle or not: better demos mean higher conversion.
Simple demo fixes that work:
- Start with a problem statement that matches the prospect's role
- Show outcomes, not screenshots
- Use real numbers or ROI examples when possible
- Keep the screen uncluttered and focus on the one or two features that matter
- End with a specific next step and commitment
One client reduced sales cycle length by 35 percent after shortening demos and focusing on top objections. That freed up reps to do more calls and increased ARR growth without hiring more people.
Common mistakes and pitfalls
I’ve noticed a few recurring errors when companies try to improve their sales growth. Watch for these.
- Tracking vanity metrics - page views and demo counts feel good but don't equal revenue.
- Mixing ARR and total revenue - be consistent about the baseline you measure.
- Ignoring churn - growth that comes at the cost of retention is fragile.
- Changing multiple things at once - then you can’t tell what actually worked.
- Bad attribution - credit the wrong channels and you’ll invest in the wrong places.
- Underinvesting in onboarding - customers that don’t see value fast are more likely to churn.
A quick example: one GTM team doubled demo volume but did not change the demo quality. Win rates fell and CAC increased, leaving revenue flat. When they focused on demo quality instead, conversion went up and CAC dropped. Lesson learned: volume without quality is expensive.
How to run a simple sales growth analysis
Here’s a straightforward way to perform a sales growth analysis in a spreadsheet. No fancy BI tools required to start.
- Column A: Period (month or quarter)
- Column B: ARR at period end
- Column C: New ARR in period
- Column D: Expansion ARR
- Column E: Churned ARR
- Column F: Win rate
- Column G: Average deal size
- Column H: Pipeline coverage (total pipeline / quota)
Calculate sales growth rate for each period using the revenue growth formula. Then add a few derived columns: number of closed deals, deals per rep, and sales cycle duration. Compare months side by side. Look for trends, not one-off spikes.
In my experience, plotting win rate and average deal size over time reveals the most telling patterns. If win rate drops while deal size rises, it could mean reps are focusing on big, risky deals. If both fall, you probably have a product fit or market issue.
How to forecast growth using the formula
Forecasting gets simpler when you use a formulaic approach. Instead of guessing, build the forecast from the levers.
- Project pipeline volume for the period
- Estimate win rate based on recent performance
- Use average deal size from current bookings
- Include predicted expansion and churn
Then compute expected revenue. That gives you transparency into what needs to change to hit targets. For instance, if your forecast misses target by $200k, you can see whether you need more pipeline, a higher win rate, or bigger deals to bridge the gap.
Quick math example: if you need $200k more and your average deal size is $20k, you need 10 more wins. If your win rate is 25 percent, you need 40 additional qualified opportunities. That makes planning concrete.
Scaling sales reps and processes
Once you’ve proven a repeatable formula, you’ll want to scale. That’s where people, process, and tools come in.
- Document the ideal customer profile and qualification checklist so new reps know who to target
- Standardize the demo playbook with example call scripts and objection handling
- Use scorecards to evaluate demos and iterate on what works
- Automate repetitive follow-ups so reps focus on high-value tasks
- Capture and share winning call recordings and battle cards across the team
Hiring is easier when you have a predictable sales growth strategy. You can model ramp time, quota attainment, and the number of reps required to hit a revenue target. That reduces guesswork and keeps CAC in check.
Organizing your team around the formula
Structure your GTM teams so each function owns one or two levers. That prevents overlap and finger-pointing.
- Marketing owns pipeline volume and lead quality
- SDRs own qualification and speed to lead
- AEs own win rates and deal size
- Customer success owns retention and expansion
- Product owns product-market fit and feature prioritization
In practice, I advise monthly cross-functional reviews where teams share results tied to the formula. Keep the conversation metric-driven. “We increased pipeline by X, but win rate fell Y percent. Here’s the hypothesis and experiment.” That kind of meeting keeps everyone honest.
How to improve sales growth - specific tactics
Here are concrete tactics mapped to each lever.
- Increase win rate - Improve demos, use case studies, shorten time-to-first-value, and train reps on objection handling.
- Increase average deal size - Create packaged bundles, promote annual contracts, build value-based pricing, and introduce seat or feature tiers.
- Increase pipeline - Run targeted account-based campaigns, improve SEO and content for high-intent queries, and expand partner channels.
- Reduce sales cycle length - Streamline contract reviews, provide pricing transparency, and use trial or POC frameworks that validate quickly.
- Boost retention and expansion - Implement onboarding milestones, proactive QBRs, and success plans tied to measurable outcomes.
One practical example I like: change your pricing page to show per-seat annual savings. It’s a tiny tweak but often drives larger average contract values and better conversion.
Tools and dashboards to measure the formula
You don’t need a complicated stack to track the essentials. A CRM, a subscription billing system, and a simple BI dashboard will do. Key dashboards should show ARR movements, pipeline coverage, win rate trends, and churn by cohort.
Important view: cohort analysis that shows retention and expansion for customers by quarter of acquisition. Cohorts reveal whether growth is healthy or borrowed from aggressive discounts and unsustainable deals.
Also track demo-specific metrics if demos are critical to your funnel. Metrics like demo-to-opportunity conversion and demo length correlation with win rate will surface useful patterns. You'll start to see which demo styles convert and which stall deals.
Case study: small changes with big impact
Here’s a short, realistic story. A mid-stage SaaS company had steady pipeline but flat revenue. We ran two experiments over a quarter: tighten demo structure to focus on ROI, and introduce a one-click annual discount on the pricing page.
Results were clear. Demo-to-opportunity conversion rose 18 percent. Average deal size increased by 12 percent thanks to the annual plans. Together they produced 22 percent quarter-over-quarter ARR growth without adding reps. That’s the power of a formulaic approach.
When to hire vs when to optimize
Don’t hire more reps until you prove your existing engine can scale. If your pipeline coverage is low, hiring will dilute performance. Instead, optimize win rate and deal size first. When those metrics are steady, model how many additional reps you need to hit targets based on ramp time and expected productivity.
In short, hire for scale only after you’ve optimized the variables the new hires will inherit.
Common objections and how to respond
Here are a few objections I've heard and how I usually respond.
- "Our market is unique." - Ok. Use the formula to capture uniqueness as a variable. Unique markets still have conversion, deal size, and churn you can measure.
- "We can't change pricing every quarter." - True. You can, however, test packaging offers to a subset of prospects to measure impact without a full price change.
- "Demos won't fix product fit." - Correct. Demos won’t fix product fit, but a better demo can clarify value and reduce cycles while you work on product improvements.
These responses are simple because the formula forces practical trade-offs. Test, measure, and iterate.
How DemoDazzle helps with the sales growth formula
At DemoDazzle we focus on the demo and buyer experience because those are often the highest-leverage areas for B2B SaaS sales teams. In my experience, companies that standardize demo outcomes not only close more deals, they close them faster and at higher value.
We help teams structure demos, capture playbooks, and measure demo effectiveness across reps. That feeds directly into improving win rate and shortening sales cycles, which are two core levers in the revenue growth formula.
Putting it all together - a one page action plan
Here is a simple plan you can implement in the next 30 days.
- Pick your baseline metric - ARR, MRR, or revenue.
- Calculate headline sales growth for the last 3 periods.
- Break growth into new, expansion, and churn.
- Identify the weakest lever - win rate, deal size, pipeline, or retention.
- Run a focused experiment for that lever. Limit to one variable.
- Measure impact for one period, then scale if positive.
Repeat this cycle quarterly. It keeps improvements manageable and measurable. Small, repeatable wins compound over time.
Final thoughts
Growth is seldom a single campaign. It’s a system built from predictable parts. Learn how to calculate sales growth, map your revenue to levers you can control, and run disciplined experiments. Focus on demo quality early, move to retention as you mature, and always track the right metrics.
If you want a simple next step, pick one metric from this post and run one experiment this week. It could be as small as tweaking a demo intro or adding a one-click annual plan. Keep it measurable and see what happens.
Helpful Links & Next Steps
FAQs
1. What is the sales growth formula?
The sales growth formula is a measure of how much money made a business from its sales increased during a certain period of time. Sales Growth Rate = (Current Period Revenue − Previous Period Revenue) / Previous Period Revenue × 100%
2. Why is the sales growth formula so B2B SaaS companies vital?
By utilizing this formula, the different departments are capable of comprehending the factors that influence revenue and thus, being able to optimize the levers (pipeline, win rate, deal size, retention) to not only increase revenue but also maintain growth in scale and have a more accurate prediction of the revenue instead of making it by guessing.
3. Which metrics are the most important in measuring sales growth?
The most important key metrics are ARR/MRR, win rate, pipeline volume, average deal size, sales cycle length, churn, expansion ARR, and LTV/CAC.
4. In what way can product demos influence sales growth?
Great demos lead to higher win rates, shorter sales cycles, and larger deal sizes. Prospects see the value of the product much quicker and therefore, they are able to finalize the purchase with their own confidence when the demos are clear and focused on the value.
5. According to this formula, what is the quickest way to increase sales growth?
Why not start by raising your win rate normally, it’s the fastest revenue lever. You can achieve it by running focused and short experiments such as perfecting the demo script, getting more accurate in qualifying, or enhancing follow-up sequences.